Creates a geom layer to plot a Multivariate Functional Data Object
with ggplot
Source: R/00_mfd.R
geom_mfd.RdCreates a geom layer to plot a Multivariate Functional Data Object
with ggplot
geom_mfd(
  mapping = NULL,
  data = NULL,
  mfdobj,
  stat = "identity",
  position = "identity",
  na.rm = TRUE,
  orientation = NA,
  show.legend = NA,
  inherit.aes = TRUE,
  type_mfd = "mfd",
  ...
)
Arguments
- mapping
Set of aesthetic mappings additional to
xandyas passed to the functionggplot2::geom:line.- data
A
data.frameproviding columns to create additional aesthetic mappings. It must contain a column "id" with the replication values as inmfdobj$fdnames[[2]]. If it contains a column "var", this must contain the functional variables as inmfdobj$fdnames[[3]].- mfdobj
A multivariate functional data object of class mfd.
- stat
See
ggplot2::geom_line.- position
See
ggplot2::geom_line.- na.rm
See
ggplot2::geom_line.- orientation
See
ggplot2::geom_line.- show.legend
See
ggplot2::geom_line.- inherit.aes
See
ggplot2::geom_line.- type_mfd
A character value equal to "mfd" or "raw". If "mfd", the smoothed functional data are plotted, if "raw", the original discrete data are plotted.
- ...
See
ggplot2::geom_line.
Value
A geom_line layer to be added to
ggplot2::ggplot()in order to plot mfdobj.
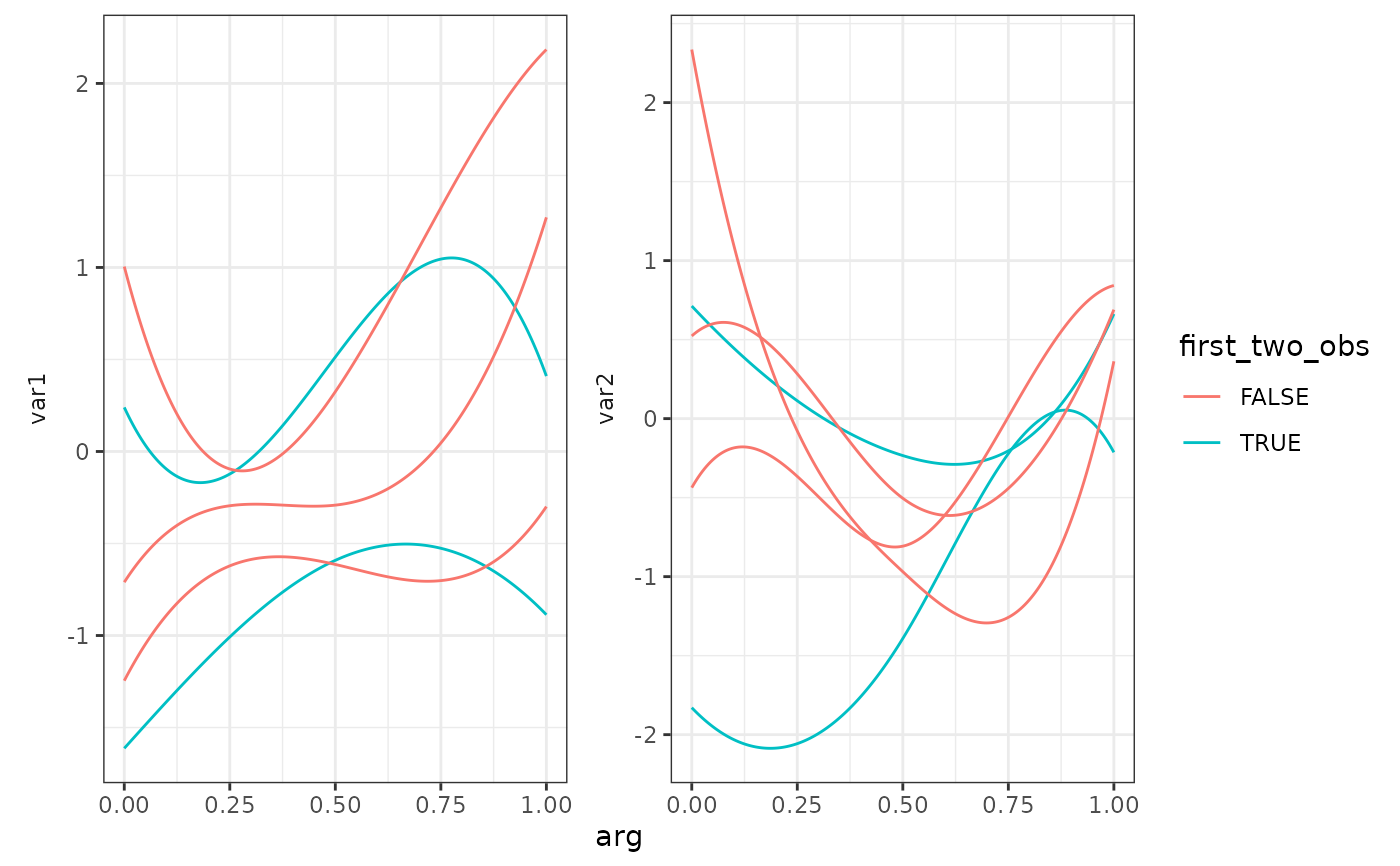
Examples
library(funcharts)
mfdobj <- data_sim_mfd()
ids <- mfdobj$fdnames[[2]]
df <- data.frame(id = ids, first_two_obs = ids %in% c("rep1", "rep2"))
ggplot() +
  geom_mfd(mapping = aes(colour = first_two_obs),
           data = df,
           mfdobj = mfdobj)