The mfd class
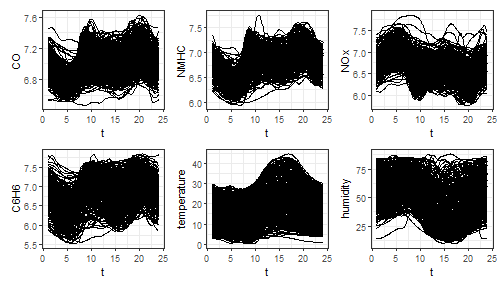
Let us show how the funcharts package works through an
example with the dataset air, which has been included from
the R package FRegSigCom and is used in the paper of Qi and
Luo (2019).
Getting multivariate functional data and the mfd
class
We provide the mfd class for multivariate functional
data. It inherits from the fd class but provides some
additional features:
- It forces the
coefargument to be an array even when the number of functional observations and/or the number of functional variables are one - It provides a better subset function
[that never drops dimensions, then it always returns amfdobject with three-dimensional array argumentcoef; moreover it allows extracting observations/variables also by name - When possible, it stores the original raw data in the long data frame format
The first thing is to get the mfd object from discrete
data. We currently allow two types of input with the two functions:
-
get_mfd_data.frame: first input must be a data.frame in the long format, with:- one
argcolumn giving the argument (x) values, - one
idcolumn indicating the functional observation, - one column per each functional variable indicating the corresponding
yvalues
- one
-
get_mfd_list: first input must be a list of matrices for the case all functional data are observed on the same grid, which:- must have all the same dimension,
- have the variable names as name of the list,
- are such that, for each matrix:
- each row corresponds to a functional observation
- each column corresponds to a point on the grid
In this example, the dataset air is in the second format
(list of matrices, with data observed on the same grid)

