Add the plot of a new multivariate functional data object to an existing plot.
Source:R/00_mfd.R
lines_mfd.RdAdd the plot of a new multivariate functional data object to an existing plot.
lines_mfd(
  plot_mfd_obj,
  mfdobj_new,
  mapping = NULL,
  data = NULL,
  stat = "identity",
  position = "identity",
  na.rm = TRUE,
  orientation = NA,
  show.legend = NA,
  inherit.aes = TRUE,
  type_mfd = "mfd",
  y_lim_equal = FALSE,
  ...
)
Arguments
- plot_mfd_obj
A plot produced by
link{plot_mfd}- mfdobj_new
A new multivariate functional data object of class mfd to be plotted.
- mapping
See
plot_mfd.- data
See
plot_mfd.- stat
See
plot_mfd.- position
See
plot_mfd.- na.rm
See
plot_mfd.- orientation
See
plot_mfd.- show.legend
See
plot_mfd.- inherit.aes
See
plot_mfd.- type_mfd
See
plot_mfd.- y_lim_equal
See
plot_mfd.- ...
See
plot_mfd.
Value
A plot of the multivariate functional data object added to the existing one.
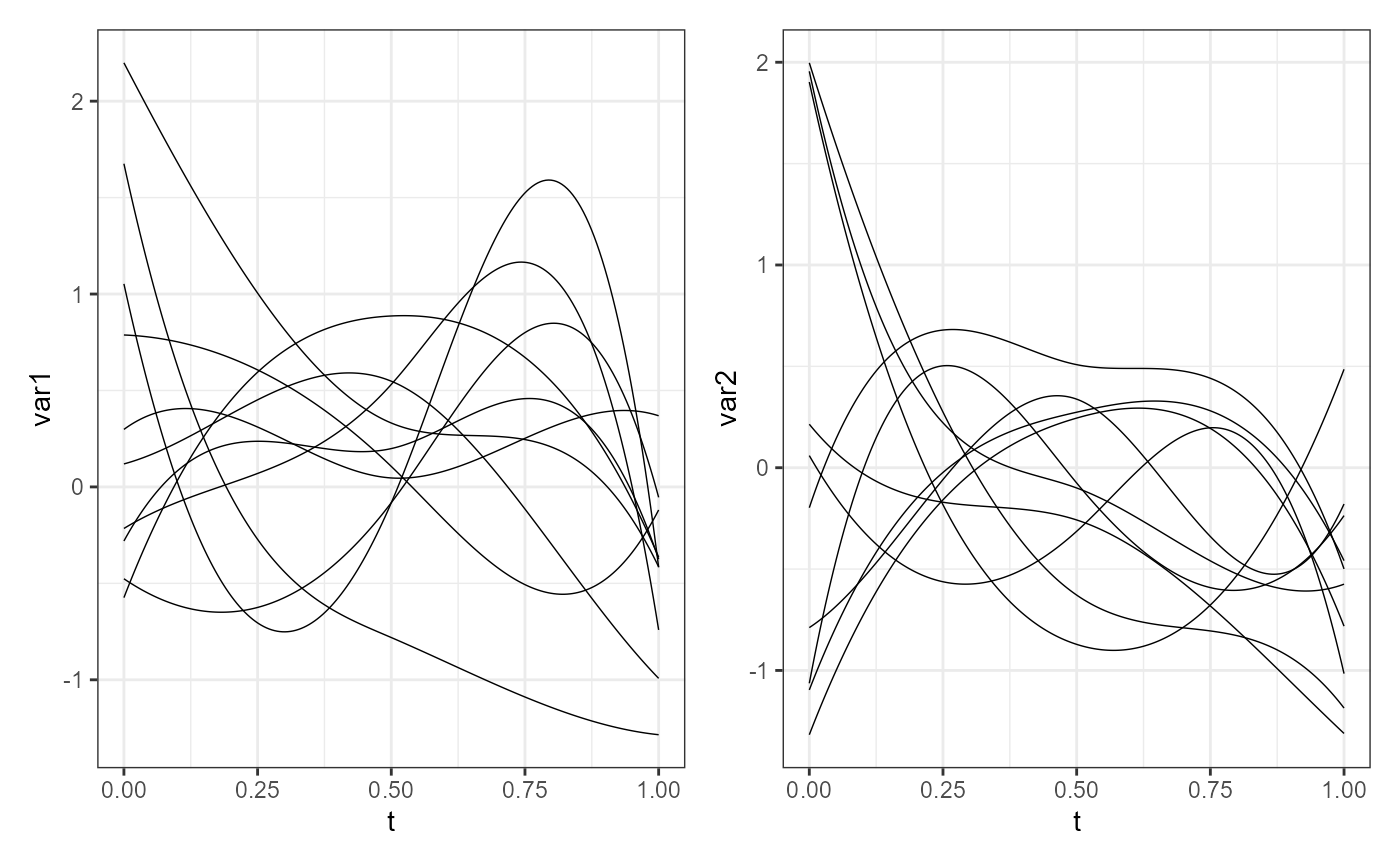
Examples
library(funcharts)
library(ggplot2)
mfdobj1 <- data_sim_mfd()
mfdobj2 <- data_sim_mfd()
p <- plot_mfd(mfdobj1)
lines_mfd(p, mfdobj_new = mfdobj2)