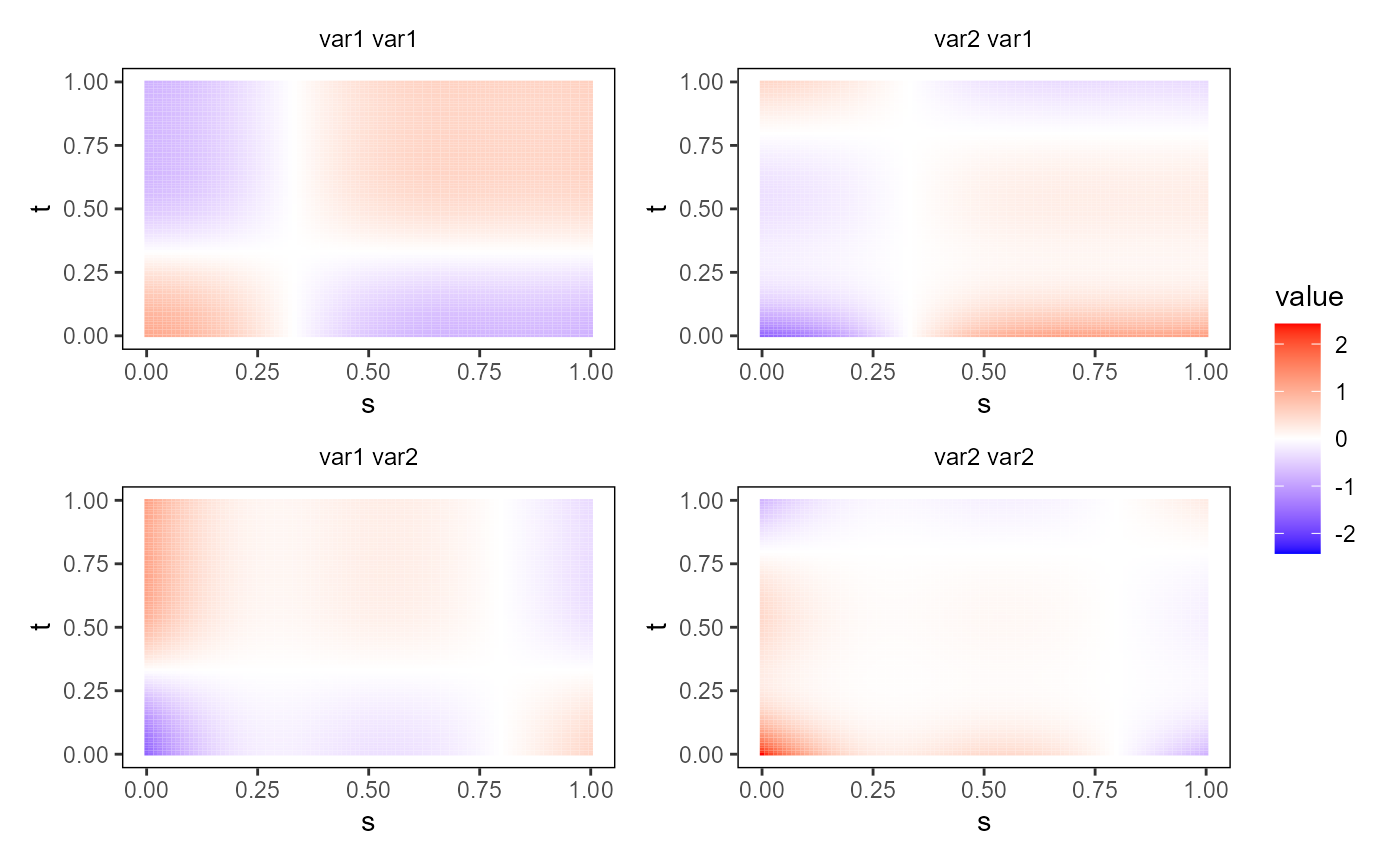
Plot an object of class bifd using
ggplot2 and geom_tile.
The object must contain only one single functional replication.
plot_bifd(bifd_obj, type_plot = "raster", phi = 40, theta = 40)Arguments
- bifd_obj
A bivariate functional data object of class bifd, containing one single replication.
- type_plot
a character value If "raster", it plots the bivariate functional data object as a raster image. If "contour", it produces a contour plot. If "perspective", it produces a perspective plot. Default value is "raster".
- phi
If
type_plot=="perspective", it is thephiargument of the functionplot3D::persp3D.- theta
If
type_plot=="perspective", it is thethetaargument of the functionplot3D::persp3D.
Value
A ggplot with a geom_tile layer providing a plot of the bivariate functional data object as a heat map.
Examples
library(funcharts)
mfdobj <- data_sim_mfd(nobs = 1)
tp <- tensor_product_mfd(mfdobj)
plot_bifd(tp)