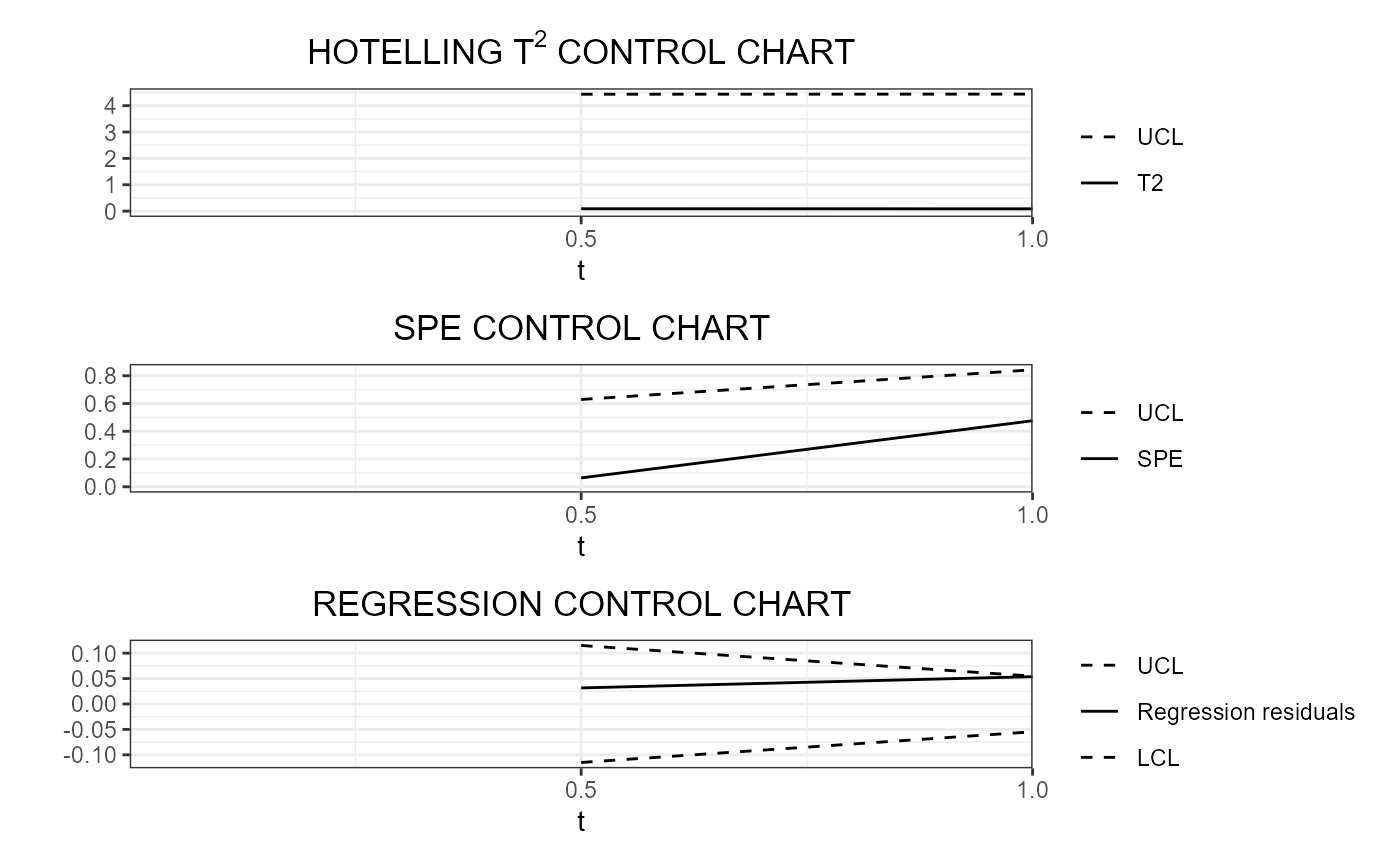
This function produces a ggplot
with the desired real-time control charts.
It takes as input a list of data frames, produced
with functions such as
regr_cc_fof_real_time and
control_charts_sof_pc_real_time,
and the id of the observations for which real-time control charts
are desired to be plotted.
For each control chart, the solid line corresponds to the
profile of the monitoring statistic and it is compared against
control limits plotted as dashed lines.
If a line is outside its limits it is coloured in red.
plot_control_charts_real_time(cclist, id_num)Arguments
- cclist
A list of data frames, produced with functions such as
regr_cc_fof_real_timeandcontrol_charts_sof_pc_real_time,- id_num
An index number giving the observation in the phase II data set to be plotted, i.e. 1 for the first observation, 2 for the second, and so on.
Value
A ggplot with the real-time functional control charts.
Details
If the line, representing the profile of the monitoring statistic over the functional domain, is out-of-control, then it is coloured in red.
Examples
library(funcharts)
data("air")
air1 <- lapply(air, function(x) x[1:8, , drop = FALSE])
air2 <- lapply(air, function(x) x[9:10, , drop = FALSE])
mfdobj_x1_list <- get_mfd_list_real_time(air1[c("CO", "temperature")],
                                         n_basis = 15,
                                         lambda = 1e-2,
                                         k_seq = c(0.5, 1))
mfdobj_x2_list <- get_mfd_list_real_time(air2[c("CO", "temperature")],
                                         n_basis = 15,
                                         lambda = 1e-2,
                                         k_seq = c(0.5, 1))
y1 <- rowMeans(air1$NO2)
y2 <- rowMeans(air2$NO2)
mod_list <- sof_pc_real_time(y1, mfdobj_x1_list)
cclist <- regr_cc_sof_real_time(
  mod_list = mod_list,
  y_new = y2,
  mfdobj_x_new = mfdobj_x2_list,
  include_covariates = TRUE)
plot_control_charts_real_time(cclist, 1)