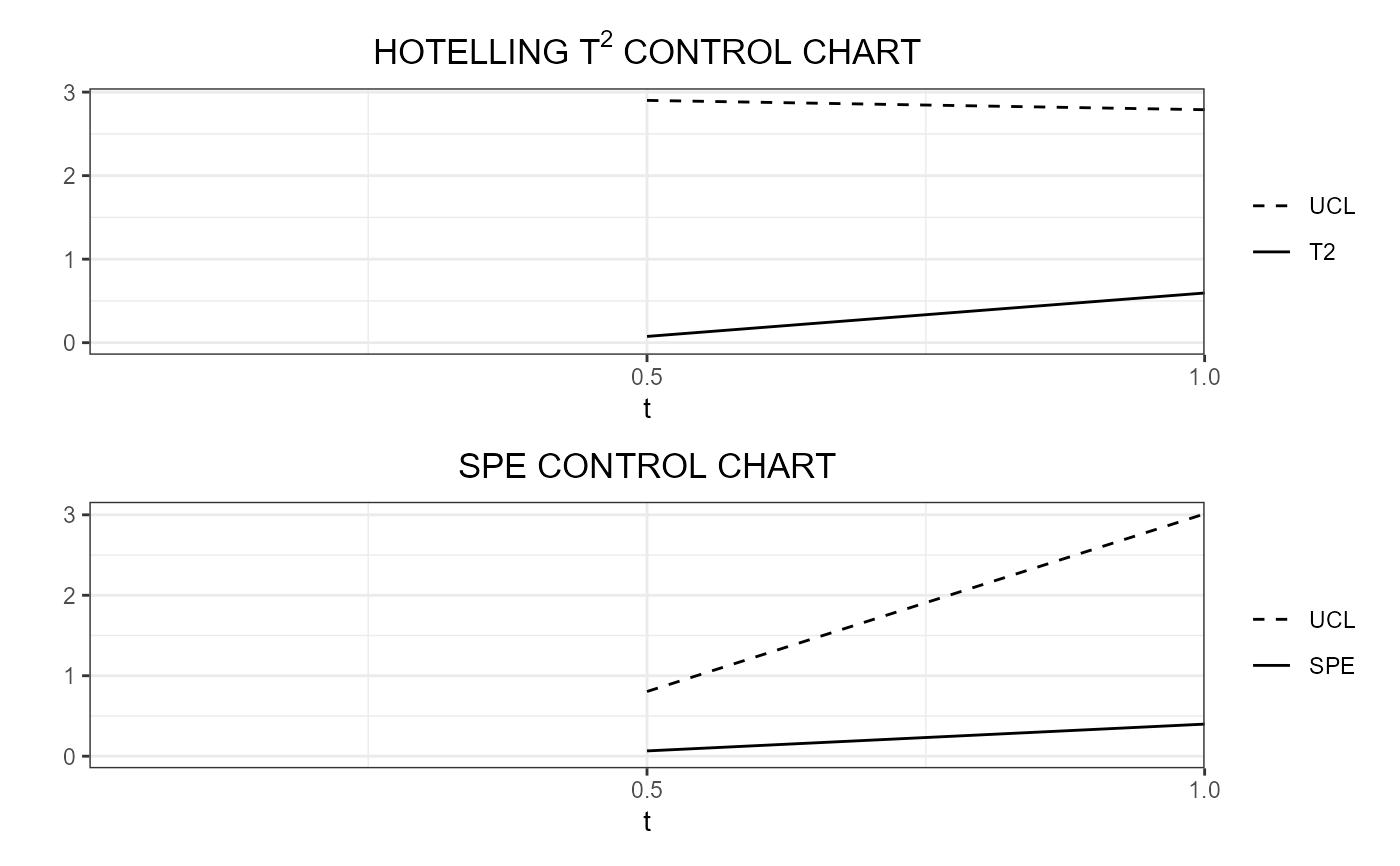
Real-time T2 and SPE control charts for multivariate functional data
Source:R/real_time_04_phaseII.R
control_charts_pca_mfd_real_time.RdThis function produces a list of data frames,
each of them is produced by control_charts_pca
and is needed to plot control charts for monitoring
multivariate functional covariates
each evolving up to an intermediate domain point.
control_charts_pca_mfd_real_time(
  pca_list,
  components_list = NULL,
  mfdobj_x_test,
  mfdobj_x_tuning = NULL,
  alpha = 0.05,
  limits = "standard",
  seed,
  nfold = NULL,
  tot_variance_explained = 0.9,
  single_min_variance_explained = 0,
  absolute_error = FALSE,
  ncores = 1
)
Arguments
- pca_list
A list of lists produced by
pca_mfd_real_time, containing a list of multivariate functional principal component analysis models estimated on functional data each evolving up to an intermediate domain point.- components_list
A list of components given as input to
pca_mfdfor each intermediate domain point.- mfdobj_x_test
A list created using
get_mfd_df_real_timeorget_mfd_list_real_time, denoting a list of functional data objects in the phase II monitoring data set, each evolving up to an intermediate domain point, with observations of the multivariate functional data. The length of this list andpca_listmust be equal, and their elements in the same position in the list must correspond to the same intermediate domain point.- mfdobj_x_tuning
A list created using
get_mfd_df_real_timeorget_mfd_list_real_time, denoting a list of functional data objects in the tuning data set (used to estimate control chart limits), each evolving up to an intermediate domain point, with observations of the multivariate functional data The length of this list andpca_listmust be equal, and their elements in the same position in the list must correspond to the same intermediate domain point. If NULL, the training data, i.e. the functional data inpca_list, are also used as the tuning data set. Default is NULL.- alpha
See
control_charts_pca.- limits
See
control_charts_pca.- seed
Deprecated: See
control_charts_pca.- nfold
See
control_charts_pca.- tot_variance_explained
See
control_charts_pca.- single_min_variance_explained
See
control_charts_pca.- absolute_error
See
control_charts_pca.- ncores
If you want parallelization, give the number of cores/threads to be used when creating objects separately for different instants.
Value
A list of data.frames each
produced by control_charts_pca,
corresponding to a given instant.
See also
Examples
library(funcharts)
data("air")
air1 <- lapply(air, function(x) x[1:8, , drop = FALSE])
air2 <- lapply(air, function(x) x[9:10, , drop = FALSE])
mfdobj_x1_list <- get_mfd_list_real_time(air1[c("CO", "temperature")],
                                         n_basis = 15,
                                         lambda = 1e-2,
                                         k_seq = c(0.5, 1))
mfdobj_x2_list <- get_mfd_list_real_time(air2[c("CO", "temperature")],
                                         n_basis = 15,
                                         lambda = 1e-2,
                                         k_seq = c(0.5, 1))
pca_list <- pca_mfd_real_time(mfdobj_x1_list)

cclist <- control_charts_pca_mfd_real_time(
  pca_list = pca_list,
  components_list = 1:3,
  mfdobj_x_test = mfdobj_x2_list)
plot_control_charts_real_time(cclist, 1)