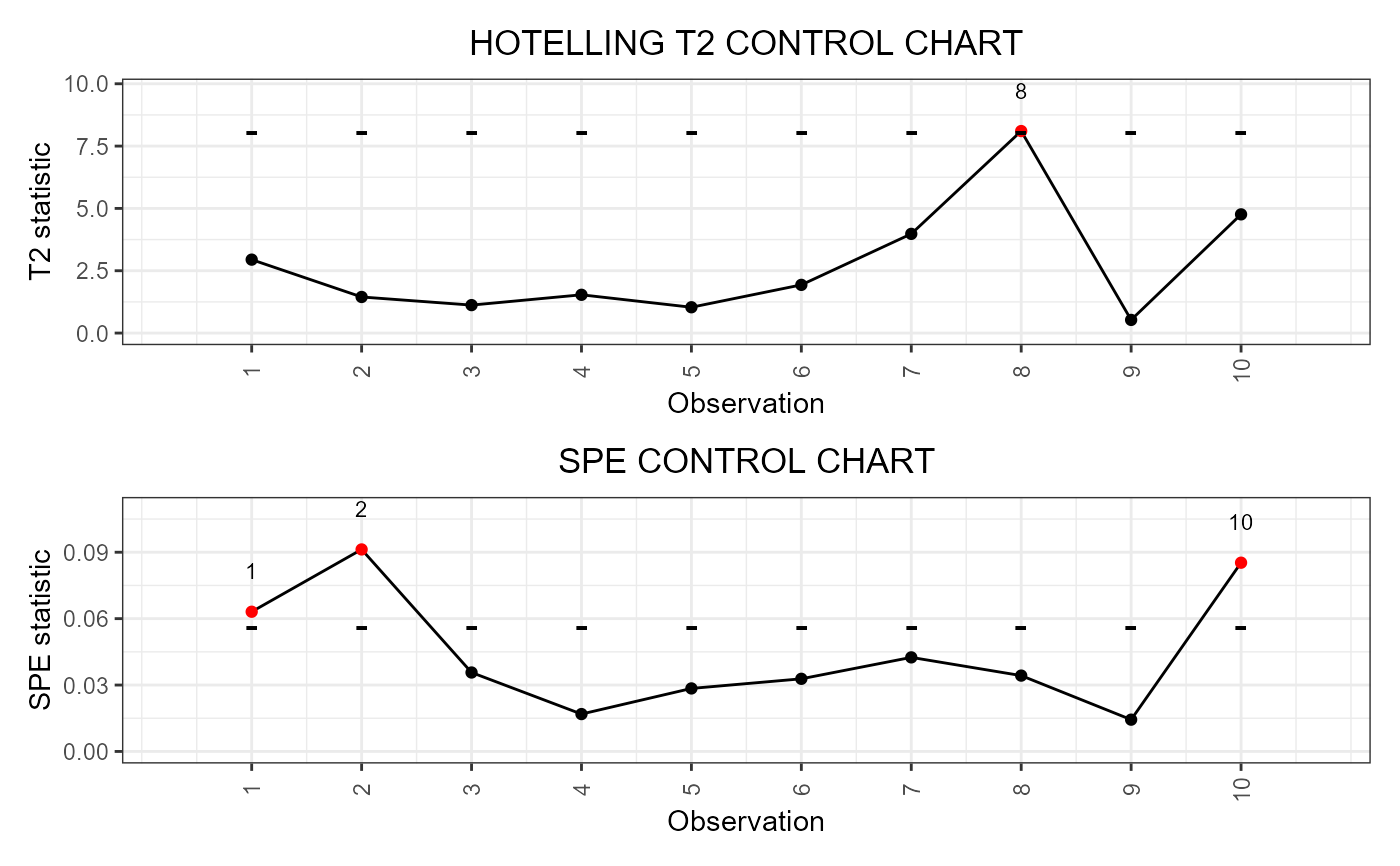
It builds a data frame needed to plot the Functional Regression Control Chart introduced in Centofanti et al. (2021), for monitoring a functional quality characteristic adjusted for by the effect of multivariate functional covariates, based on a fitted function-on-function linear regression model. The training data have already been used to fit the model. An optional tuning data set can be provided that is used to estimate the control chart limits. A phase II data set contains the observations to be monitored with the control charts. It also allows to jointly monitor the multivariate functional covariates.
regr_cc_fof(
  object,
  mfdobj_y_new,
  mfdobj_x_new,
  mfdobj_y_tuning = NULL,
  mfdobj_x_tuning = NULL,
  alpha = 0.05,
  include_covariates = FALSE,
  absolute_error = FALSE
)
Arguments
- object
A list obtained as output from
fof_pc, i.e. a fitted function-on-function linear regression model.- mfdobj_y_new
An object of class
mfdcontaining the phase II data set of the functional response observations to be monitored.- mfdobj_x_new
An object of class
mfdcontaining the phase II data set of the functional covariates observations to be monitored.- mfdobj_y_tuning
An object of class
mfdcontaining the tuning data set of the functional response observations, used to estimate the control chart limits. If NULL, the training data, i.e. the data used to fit the function-on-function linear regression model, are also used as the tuning data set, i.e.mfdobj_y_tuning=object$pca_y$data. Default is NULL.- mfdobj_x_tuning
An object of class
mfdcontaining the tuning data set of the functional covariates observations, used to estimate the control chart limits. If NULL, the training data, i.e. the data used to fit the function-on-function linear regression model, are also used as the tuning data set, i.e.mfdobj_x_tuning=object$pca_x$data. Default is NULL.- alpha
If it is a number between 0 and 1, it defines the overall type-I error probability. By default, it is equal to 0.05 and the Bonferroni correction is applied by setting the type-I error probabilities equal to
alpha/2in the Hotelling's T2 and SPE control charts. Ifinclude_covariatesisTRUE, i.e., the Hotelling's T2 and SPE control charts are built also on the multivariate functional covariates, then the Bonferroni correction is applied by setting the type-I error probability in the four control charts equal toalpha/4. If you want to set manually the Type-I error probabilities, then the argumentalphamust be a named list with elements named asT2,spe,T2_xand,spe_x, respectively, containing the desired Type I error probability of the T2 and SPE control charts for the functional response and the multivariate functional covariates, respectively.- include_covariates
If TRUE, also functional covariates are monitored through
control_charts_pca,. If FALSE, only the functional response, conditionally on the covariates, is monitored.- absolute_error
A logical value that, if
include_covariatesis TRUE, is passed tocontrol_charts_pca.
Value
A data.frame containing the output of the
function control_charts_pca applied to
the prediction errors.
References
Centofanti F, Lepore A, Menafoglio A, Palumbo B, Vantini S. (2021) Functional Regression Control Chart. Technometrics, 63(3), 281--294. <doi:10.1080/00401706.2020.1753581>
See also
Examples
library(funcharts)
data("air")
air <- lapply(air, function(x) x[1:100, , drop = FALSE])
fun_covariates <- c("CO", "temperature")
mfdobj_x <- get_mfd_list(air[fun_covariates],
                         n_basis = 15,
                         lambda = 1e-2)
mfdobj_y <- get_mfd_list(air["NO2"],
                         n_basis = 15,
                         lambda = 1e-2)
mfdobj_y1 <- mfdobj_y[1:60]
mfdobj_y_tuning <- mfdobj_y[61:90]
mfdobj_y2 <- mfdobj_y[91:100]
mfdobj_x1 <- mfdobj_x[1:60]
mfdobj_x_tuning <- mfdobj_x[61:90]
mfdobj_x2 <- mfdobj_x[91:100]
mod_fof <- fof_pc(mfdobj_y1, mfdobj_x1)
cclist <- regr_cc_fof(mod_fof,
                      mfdobj_y_new = mfdobj_y2,
                      mfdobj_x_new = mfdobj_x2,
                      mfdobj_y_tuning = NULL,
                      mfdobj_x_tuning = NULL)
plot_control_charts(cclist)
