This function takes as input a data frame produced
with functions such as
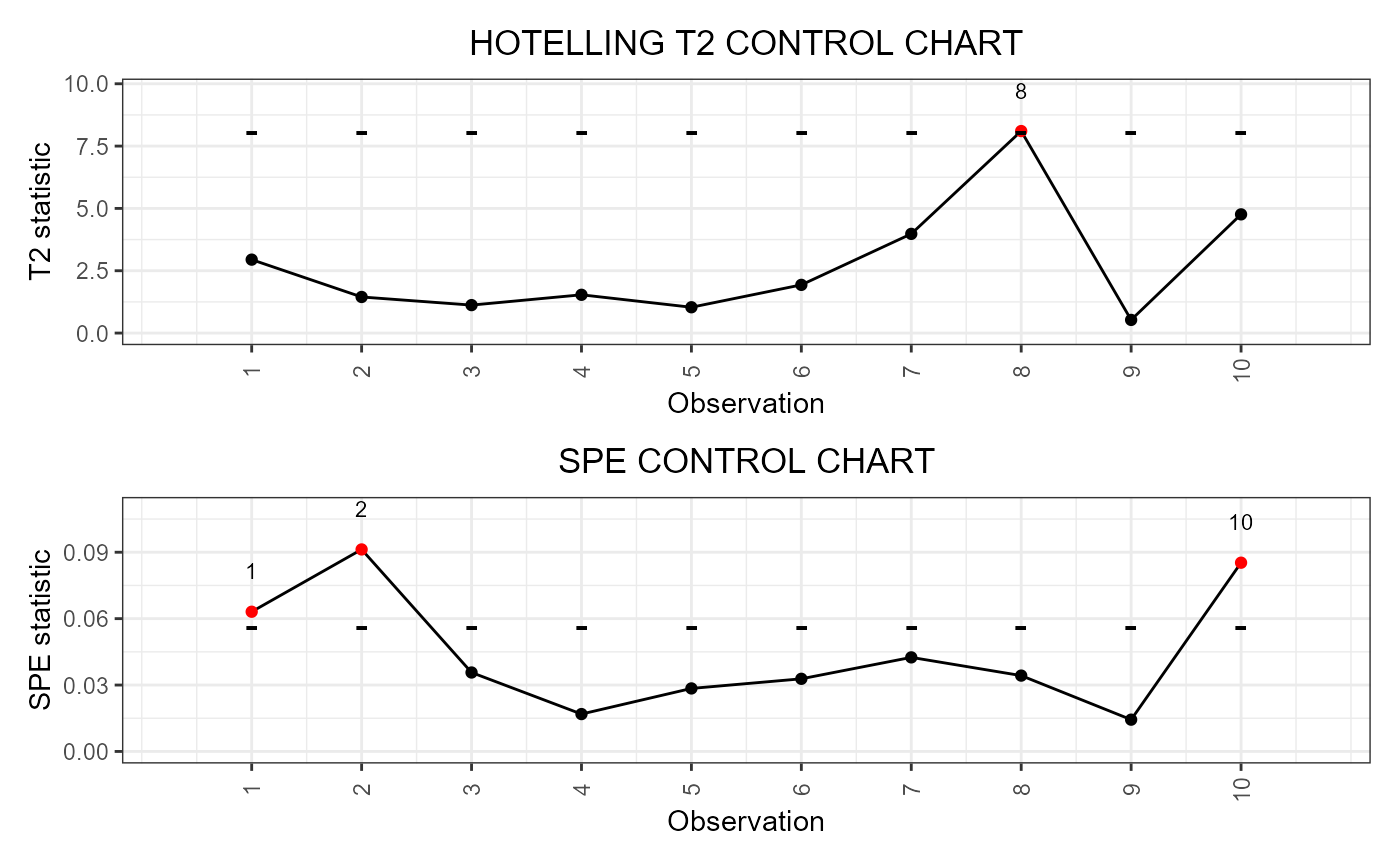
control_charts_pca and control_charts_sof_pc and
produces a ggplot with the desired control charts, i.e.
it plots a point for each
observation in the phase II data set against
the corresponding control limits.
plot_control_charts(cclist, nobsI = 0)Arguments
- cclist
A
data.frameproduced bycontrol_charts_pca,control_charts_sof_pcregr_cc_fof, orregr_cc_sof.- nobsI
An integer indicating the first observations that are plotted in gray. It is useful when one wants to plot the phase I data set together with the phase II data. In that case, one needs to indicate the number of phase I observations included in
cclist. Default is zero.
Value
A ggplot with the functional control charts.
Details
Out-of-control points are signaled by colouring them in red.
Examples
library(funcharts)
data("air")
air <- lapply(air, function(x) x[1:100, , drop = FALSE])
fun_covariates <- c("CO", "temperature")
mfdobj_x <- get_mfd_list(air[fun_covariates],
                         n_basis = 15,
                         lambda = 1e-2)
mfdobj_y <- get_mfd_list(air["NO2"],
                         n_basis = 15,
                         lambda = 1e-2)
mfdobj_y1 <- mfdobj_y[1:60]
mfdobj_y_tuning <- mfdobj_y[61:90]
mfdobj_y2 <- mfdobj_y[91:100]
mfdobj_x1 <- mfdobj_x[1:60]
mfdobj_x_tuning <- mfdobj_x[61:90]
mfdobj_x2 <- mfdobj_x[91:100]
mod_fof <- fof_pc(mfdobj_y1, mfdobj_x1)
cclist <- regr_cc_fof(mod_fof,
                      mfdobj_y_new = mfdobj_y2,
                      mfdobj_x_new = mfdobj_x2,
                      mfdobj_y_tuning = NULL,
                      mfdobj_x_tuning = NULL)
plot_control_charts(cclist)