This function produces a contribution plot from functional control charts for a given observation of a phase II data set, using ggplot.
cont_plot(cclist, id_num, which_plot = c("T2", "spe"), print_id = FALSE)Arguments
- cclist
A
data.frameproduced bycontrol_charts_pca,control_charts_sof_pcregr_cc_fof, orregr_cc_sof.- id_num
An index number giving the observation in the phase II data set to be plotted, i.e. 1 for the first observation, 2 for the second, and so on.
- which_plot
A character vector. Each value indicates which contribution you want to plot:
"T2" indicates contribution to the Hotelling's T2 statistic,
"spe" indicates contribution to the squared prediction error statistic.
- print_id
A logical value, if TRUE, it prints also the id of the observation in the title of the ggplot. Default is FALSE.
Value
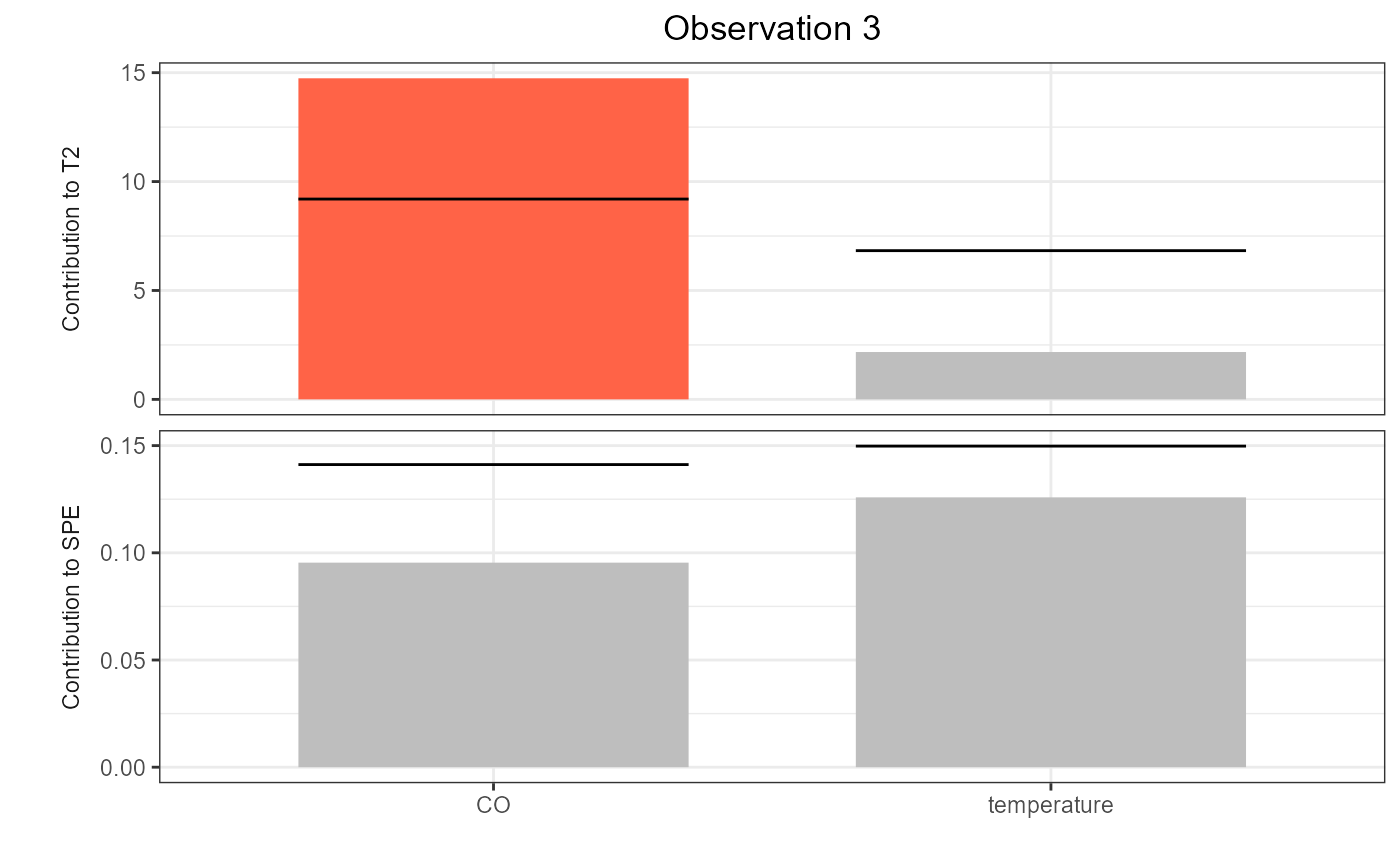
A ggplot containing the contributions of functional variables to the monitoring statistics. Each plot is a bar plot, with bars corresponding to contribution values and horizontal black segments denoting corresponding (empirical) upper limits. Bars are coloured by red if contributions exceed their limit.
Examples
library(funcharts)
data("air")
air <- lapply(air, function(x) x[201:300, , drop = FALSE])
fun_covariates <- c("CO", "temperature")
mfdobj_x <- get_mfd_list(air[fun_covariates],
                         n_basis = 15,
                         lambda = 1e-2)
y <- rowMeans(air$NO2)
y1 <- y[1:60]
y_tuning <- y[61:90]
y2 <- y[91:100]
mfdobj_x1 <- mfdobj_x[1:60]
mfdobj_x_tuning <- mfdobj_x[61:90]
mfdobj_x2 <- mfdobj_x[91:100]
mod <- sof_pc(y1, mfdobj_x1)
cclist <- regr_cc_sof(object = mod,
                      y_new = y2,
                      mfdobj_x_new = mfdobj_x2,
                      y_tuning = y_tuning,
                      mfdobj_x_tuning = mfdobj_x_tuning,
                      include_covariates = TRUE)
get_ooc(cclist)
#>      id    T2   spe     y contribution_T2_CO contribution_T2_temperature
#> 91   91 FALSE FALSE FALSE              FALSE                       FALSE
#> 92   92 FALSE FALSE FALSE              FALSE                       FALSE
#> 93   93  TRUE FALSE FALSE               TRUE                       FALSE
#> 94   94 FALSE FALSE FALSE              FALSE                       FALSE
#> 95   95 FALSE FALSE FALSE              FALSE                       FALSE
#> 96   96 FALSE FALSE FALSE              FALSE                       FALSE
#> 97   97 FALSE FALSE FALSE              FALSE                       FALSE
#> 98   98 FALSE FALSE FALSE              FALSE                       FALSE
#> 99   99 FALSE FALSE  TRUE              FALSE                       FALSE
#> 100 100 FALSE FALSE  TRUE              FALSE                       FALSE
#>     contribution_spe_CO contribution_spe_temperature
#> 91                FALSE                        FALSE
#> 92                FALSE                        FALSE
#> 93                FALSE                        FALSE
#> 94                FALSE                        FALSE
#> 95                FALSE                        FALSE
#> 96                FALSE                        FALSE
#> 97                FALSE                        FALSE
#> 98                FALSE                        FALSE
#> 99                FALSE                        FALSE
#> 100               FALSE                        FALSE
cont_plot(cclist, 3)