Plot multivariate functional object over the training data set
Source:R/05_fault_detection.R
plot_mon.RdThis function plots selected functions in a phase_II monitoring data set against the corresponding training data set to be compared.
plot_mon(cclist, fd_train, fd_test, plot_title = FALSE, print_id = FALSE)Arguments
- cclist
A
data.frameproduced bycontrol_charts_pca,control_charts_sof_pcregr_cc_fof, orregr_cc_sof.- fd_train
An object of class
mfdcontaining the training data set of the functional variables. They are plotted in gray in the background.- fd_test
An object of class
mfdcontaining the phase II data set of the functional variables to be monitored. They are coloured in black or red on the foreground.- plot_title
A logical value. If
TRUE, it prints the title with the observation name. Default isFALSE.- print_id
A logical value. If
TRUE, and alsoplot_titleisTRUE, it prints also the id of the observation in the title of the ggplot. Default isFALSE
Value
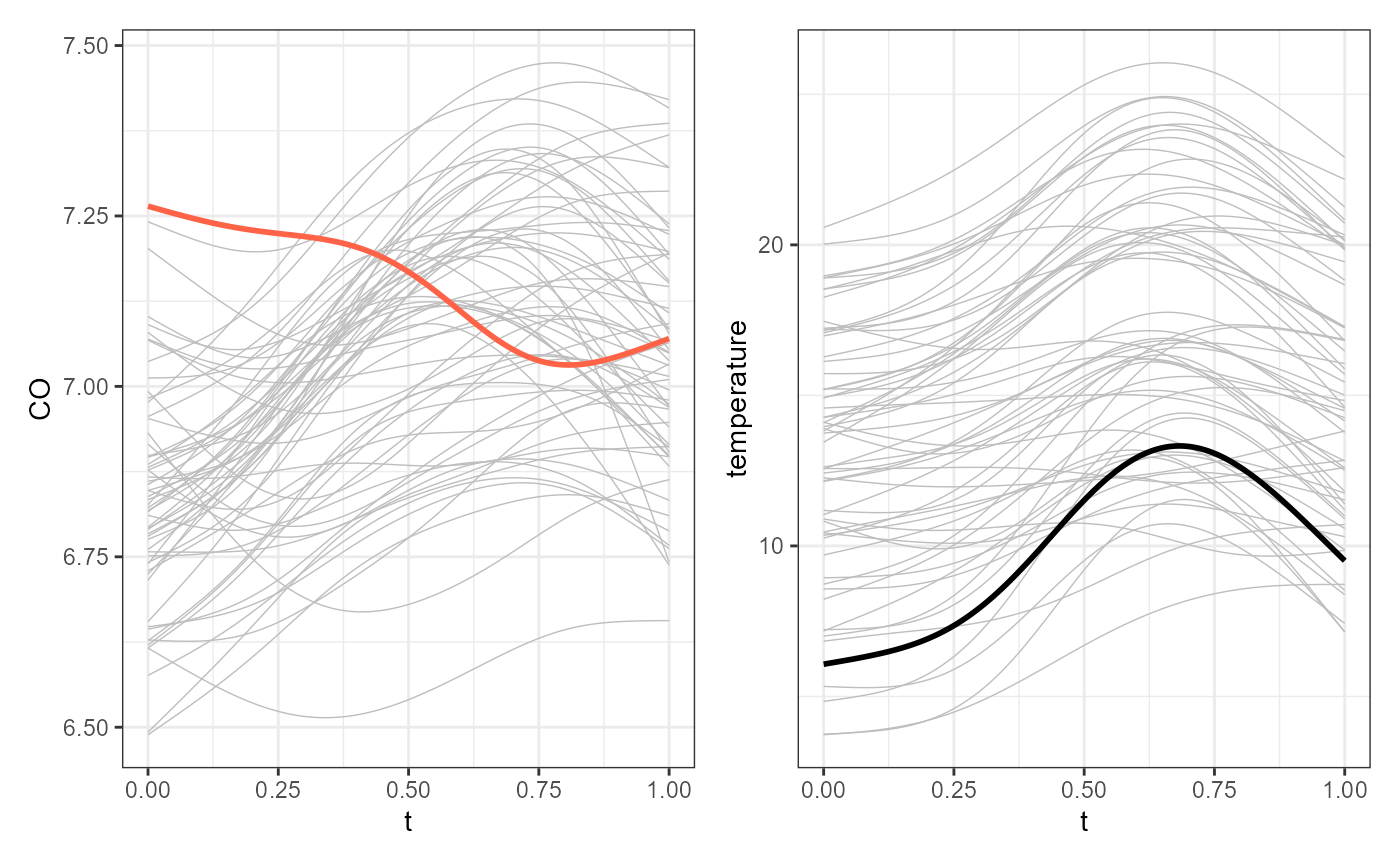
A ggplot of the multivariate functional data.
In particular, the multivariate functional data given in
fd_train are plotted on
the background in gray, while the multivariate functional data given in
fd_test are
plotted on the foreground, the colour
of each curve is black or red depending on if that curve
was signal as anomalous by at least a contribution plot.
Examples
library(funcharts)
data("air")
air <- lapply(air, function(x) x[201:300, , drop = FALSE])
fun_covariates <- c("CO", "temperature")
mfdobj_x <- get_mfd_list(air[fun_covariates],
n_basis = 15,
lambda = 1e-2)
y <- rowMeans(air$NO2)
y1 <- y[1:60]
y_tuning <- y[61:90]
y2 <- y[91:100]
mfdobj_x1 <- mfdobj_x[1:60]
mfdobj_x_tuning <- mfdobj_x[61:90]
mfdobj_x2 <- mfdobj_x[91:100]
mod <- sof_pc(y1, mfdobj_x1)
cclist <- regr_cc_sof(object = mod,
y_new = y2,
mfdobj_x_new = mfdobj_x2,
y_tuning = y_tuning,
mfdobj_x_tuning = mfdobj_x_tuning,
include_covariates = TRUE)
get_ooc(cclist)
#> id T2 spe y contribution_T2_CO contribution_T2_temperature
#> 91 91 FALSE FALSE FALSE FALSE FALSE
#> 92 92 FALSE FALSE FALSE FALSE FALSE
#> 93 93 TRUE FALSE FALSE TRUE FALSE
#> 94 94 FALSE FALSE FALSE FALSE FALSE
#> 95 95 FALSE FALSE FALSE FALSE FALSE
#> 96 96 FALSE FALSE FALSE FALSE FALSE
#> 97 97 FALSE FALSE FALSE FALSE FALSE
#> 98 98 FALSE FALSE FALSE FALSE FALSE
#> 99 99 FALSE FALSE TRUE FALSE FALSE
#> 100 100 FALSE FALSE TRUE FALSE FALSE
#> contribution_spe_CO contribution_spe_temperature
#> 91 FALSE FALSE
#> 92 FALSE FALSE
#> 93 FALSE FALSE
#> 94 FALSE FALSE
#> 95 FALSE FALSE
#> 96 FALSE FALSE
#> 97 FALSE FALSE
#> 98 FALSE FALSE
#> 99 FALSE FALSE
#> 100 FALSE FALSE
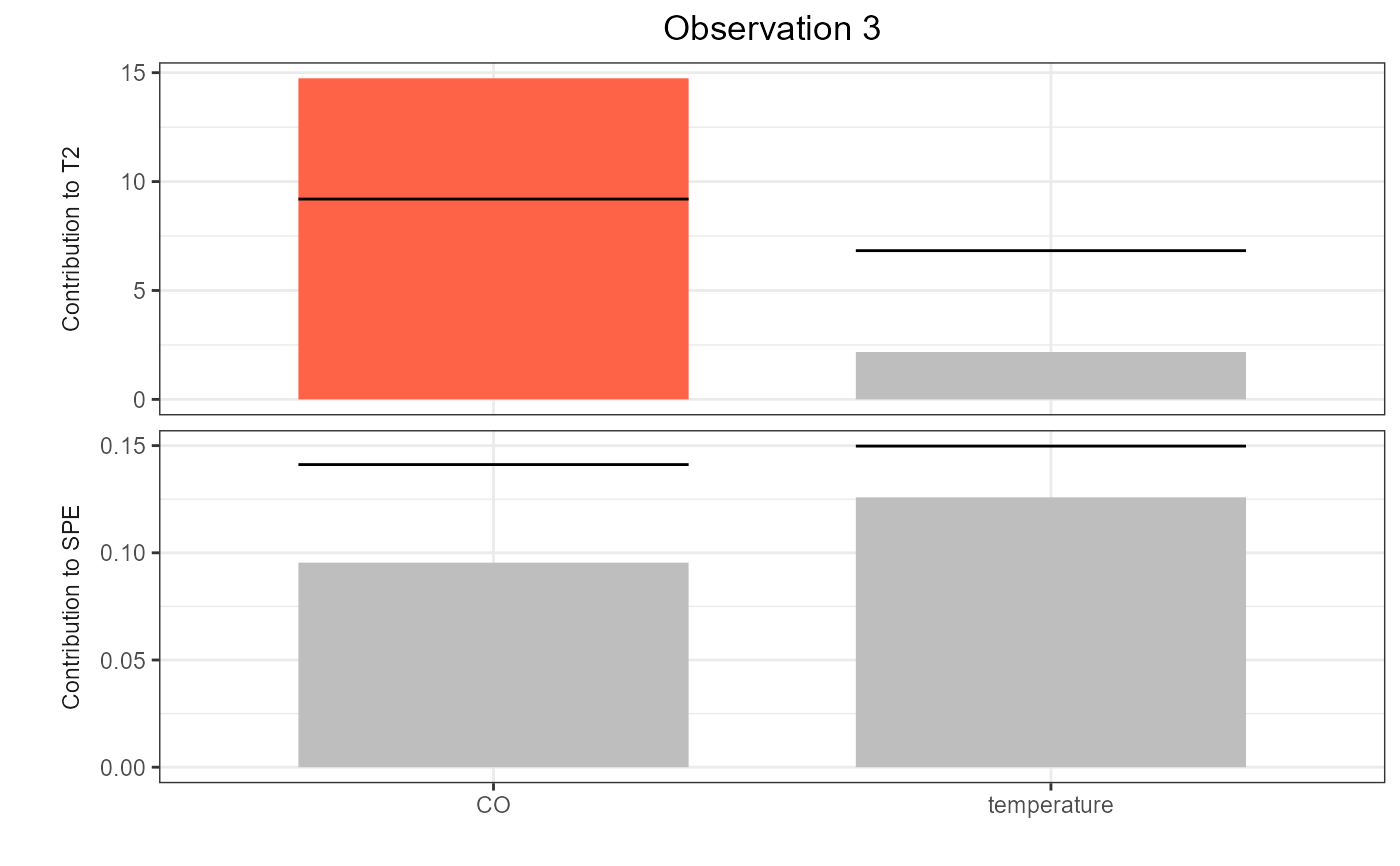
cont_plot(cclist, 3)
 plot_mon(cclist, fd_train = mfdobj_x1, fd_test = mfdobj_x2[3])